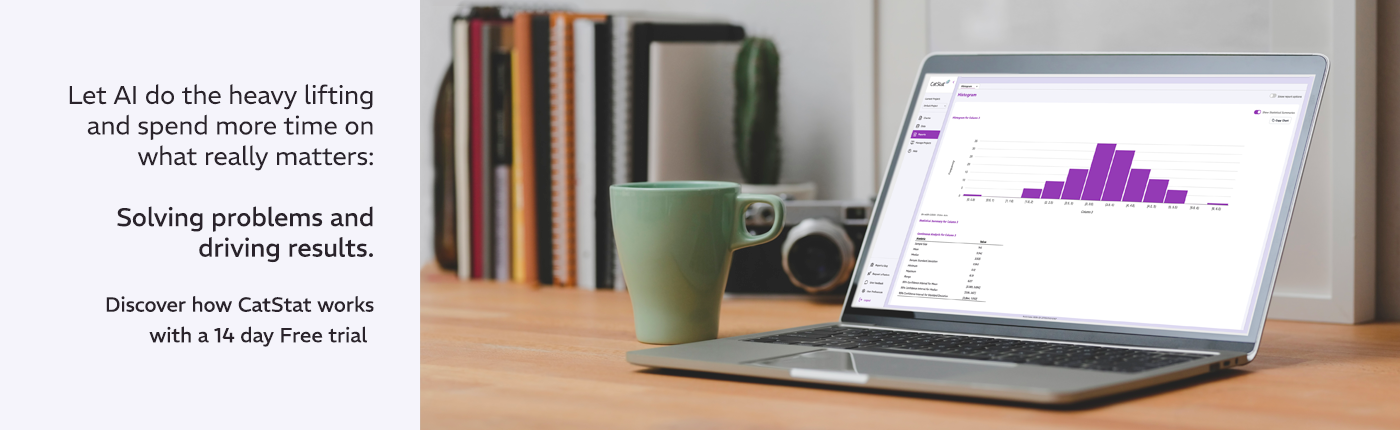
AI-guided analysis your CI projects can stand behind

CatStat is the AI-guided statistical analysis tool from Catalyst – built by practitioners, for practitioners, on thirty years of Lean Six Sigma practice. It helps your team identify issues, understand what’s driving them, and deliver measurable improvements faster, with the analytical depth real CI work demands.

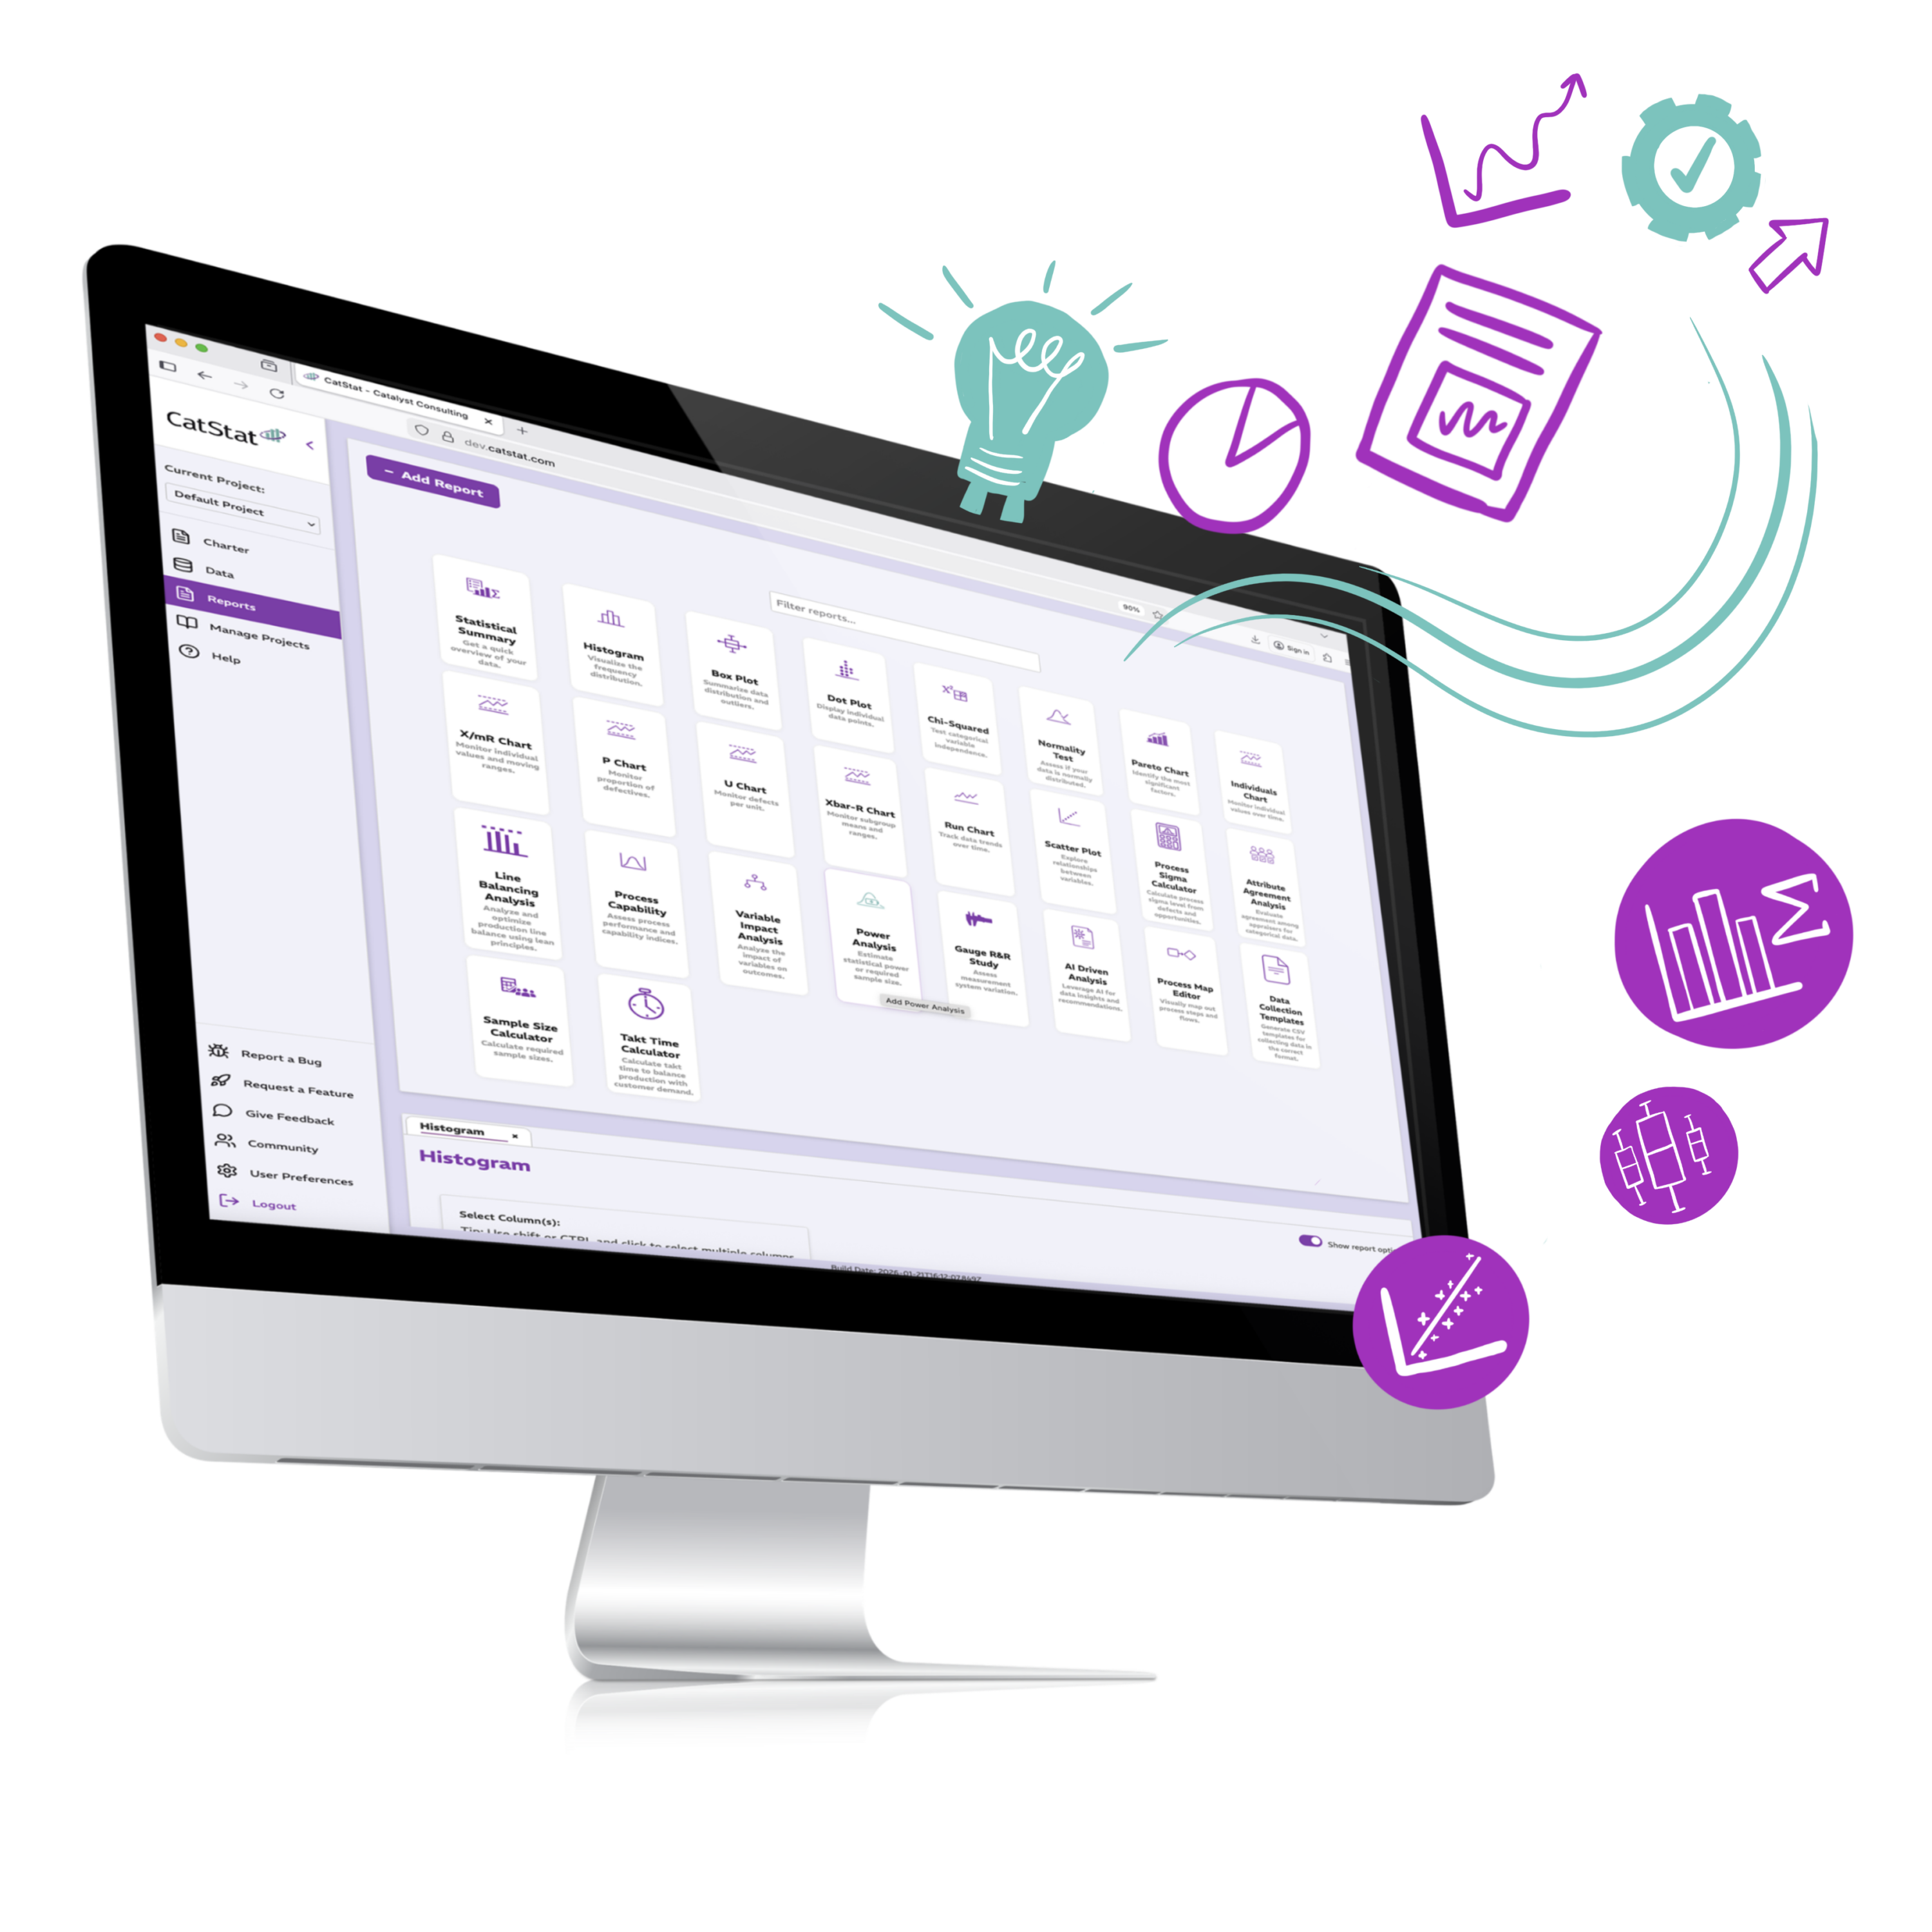
SPC Chart

Identify special cause variation

Statistical Summary

Get a quick overview of your data

Histogram

Visualise the shape of your data.

Box Plot

For segmentation, T test and ANOVA

Dot Plot

Most granular frequency plot

Pareto Chart

Identify the most significant factors.

Regression Analysis

Quantify cause-and-effect relationships

Measurement Systems Analysis

Check data for reliability.

SPC Chart

Identify special cause variation

Statistical Summary

Get a quick overview of your data

Histogram

Visualise the shape of your data.

Box Plot

For segmentation, T test and ANOVA

Dot Plot

Most granular frequency plot

Pareto Chart

Identify the most significant factors.

Regression Analysis

Quantify cause-and-effect relationships

Measurement Systems Analysis

Check data for reliability.

SPC Chart

Identify special cause variation

Statistical Summary

Get a quick overview of your data

Histogram

Visualise the shape of your data.

Box Plot

For segmentation, T test and ANOVA

Dot Plot

Most granular frequency plot

Pareto Chart

Identify the most significant factors.

Regression Analysis

Quantify cause-and-effect relationships

Measurement Systems Analysis

Check data for reliability.

How CatStat Supports your Role

Business Leaders

Get more value from your improvement programmes without increasing cost or headcount. CatStat helps more of your existing work translate into measurable, defensible results.

Change Leaders

Reduce analysis time from days to minutes. Keep projects moving, remove the delivery bottleneck where analyses get stuck, and close the gap between data and decision.

Improvement Practitioners

Maintain momentum on your project. Apply the right method to your data, understand what the output is telling you, and deliver successful improvement initiatives with AI guidance at every step.

How CatStat helps work get delivered, and people add more value

  • Developed by practitioners, for practitioners

    Shaped by thirty years of real Lean Six Sigma practice, not by theory. Everything CI projects actually need, nothing they don’t.

  • Everything your team needs in one place

    A full analytical suite (control charts, capability, ANOVA, regression, Gauge R&R and the rest) with AI guidance built in. No expensive licences, no steep learning curve, no specialist IT install. You manage the licences. You decide who has access.

  • Built on 30 years of Black Belt practice

    Expert insight encoded into every analysis, so your practitioners stay confident and your senior people stay focused on leading change rather than reviewing routine work.

  • AI that knows your data

    Not a generic chatbot guessing at statistics. CatStat understands the test you are running and what the output means, so the guidance is specific, accurate, and safe to act on.

  • CatStat doesn’t change your approach – it helps your people apply it more effectively, turning the work you have already invested in into the results it was designed to achieve.
“CatStat is fabulous.  It was invaluable in interrogating the data for a piece of work that I needed to turnaround for Monday. I’m off to enjoy the weekend now as I don’t need to plug away at Excel all weekend.”

Process Improvement Lead Hastings Direct

It’s like having an extra set of expert eyes. CatStat spotted connections in our data that we never would have seen.”

Beta Group Participant

“I think the use of AI is really helpful; it’s an easy interface and I’ve found it really intuitive. You don’t need a manual. You can just go ahead and use it.”

Continuous Improvement Leader, Lloyd’s Register

“I find myself looking forward to using CatStat because of how intuitive and user friendly it is.”

Continuous Improvement Leader, Lloyd’s Register

“Not being particularly confident in the area of statistics, CatStat is amazingly helpful for me because you can just give it a go….. it’s a game changer, for sure.”

Continuous Improvement Leader, Lloyd’s Register

Choose Your Plan


Each plan includes a 14-day free trial, secure cloud access, and our full analytics suite. Pay only for what you use. Upgrade or cancel any time.

CatStat Basic

For Yellow Belts and Lean practitioners starting out. Foundational analytics – Histogram, Pareto Chart, Run Chart, Scatter Plot, Individuals Chart – with AI-driven interpretation on every result.

CatStat Plus

For Green Belts and data analysts running active improvement projects. Adds T-Test, ANOVA, Capability Analysis, Regression Analysis and Process Mapping to the toolkit.

CatStat Pro

For Black Belts, Lean Masters and CI Leaders doing in-depth analysis. Full premium toolset including advanced SPC (Xbar-R, X-mR, P, U), Gauge R&R, AAA and Line Balancing. Unlimited projects.

Book a Demo for your team

See CatStat in action with your data and your team’s projects. A 30-minute walkthrough built around your improvement programme – not a generic demo.